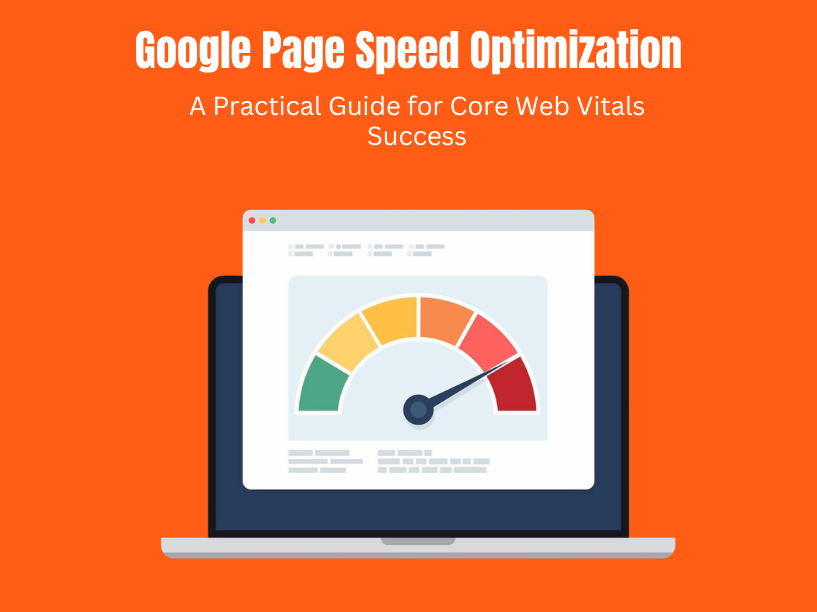

Slow web pages lose visitors, rankings, and revenue. This article walks you through what google page speed optimization actually involves in 2026, how to measure it, and how to fix it – metric by metric, layer by layer.
Page speed refers to the overall page load and perceived loading speed of your web pages across mobile and desktop devices. It directly shapes user experience, core web vitals scores, and google rankings. Google considers page speed a ranking factor since 2010, and that emphasis has only grown through Core Web Vitals updates starting in 2021 and the introduction of Interaction to Next Paint (INP) in March 2024.
Here is the uncomfortable reality: most websites have load times between 8 and 11 seconds. Meanwhile, 47% of consumers expect a website to load in 2 seconds or less. That gap kills bounce rates, tanks conversion rates, and drags down ad campaign performance across paid and organic channels.
At TVL IT Solutions, we build custom software, SaaS platforms, and enterprise solutions with performance baked in from architecture through deployment – not patched on after launch.
Page speed and page load time are related but not identical. Page speed describes how fast content appears and becomes usable. Page load time is the total duration from request to fully loaded – every resource downloaded, every script executed.
Google no longer judges your site on a single load time number. Instead, it evaluates a cluster of UX-centric metrics that reflect what real users actually experience.
The total loading process includes DNS lookup, initial TCP/TLS connection, server response time (time to first byte), HTML parsing, downloading and applying CSS files, executing JavaScript, rendering visible content, and enabling interaction. Each step in this chain can introduce delay.
Core web vitals are Google’s primary yardstick for page experience. They measure three dimensions of how users perceive your site:
Core Web Vitals include LCP, INP, and CLS metrics, and together they form the basis of Google’s page experience ranking signals.
Other metrics like Speed Index, first contentful paint, and Time to Interactive still matter for lab diagnostics, but they are not part of the three metrics Google uses in its ranking systems. Keep that distinction clear when you analyze your data.
Here is what Google considers “fast” and “stable,” broken down metric by metric.
Largest contentful paint measures the time for the largest visible element – a hero image, large heading, or prominent content block – to render in the viewport. The good threshold for largest contentful paint is ≤ 2.5 seconds at the 75th percentile. LCP measures the loading time of the largest content element, and it is heavily influenced by image size, render-blocking CSS/JS, and server response.
INP replaced first input delay in Google’s ranking systems in March 2024. While FID measured only the input delay of the first interaction, INP assesses the responsiveness of a page to user interactions across the entire session. Google’s “good” threshold for INP is ≤ 200 ms. The legacy FID threshold was under 100 ms, but that metric is now deprecated.
Cumulative layout shift measures visual stability of a page. CLS quantifies unexpected layout shifts during page loading – those jarring jumps caused by images without dimensions, late-loading ads, and dynamically injected banners. The good threshold for cumulative layout shift CLS is ≤ 0.1.
| Metric | Good | Needs Improvement | Poor |
| LCP | ≤ 2.5s | 2.5s – 4s | > 4s |
| INP | ≤ 200 ms | 200 – 500 ms | > 500 ms |
| CLS | ≤ 0.1 | 0.1 – 0.25 | > 0.25 |
Together, these three categories reflect perceived speed: LCP for loading, INP for next paint responsiveness, and CLS for stability.
You cannot optimize what you do not measure. Start with the most accessible online tool available: Google PageSpeed Insights.
PageSpeed Insights (pagespeed.web.dev) is a free online version of Google’s performance testing suite. It combines Lighthouse lab data with Chrome User Experience Report (CrUX) field data into a single pagespeed insights report. A score of 90 or above in PageSpeed Insights is considered good in the performance category.
The distinction between lab data and field data matters:
PageSpeed Insights analyzes web performance on mobile and desktop separately. PSI categorizes user experiences into Good, Needs Improvement, and Poor – the same three categories used in Search Console’s Core Web Vitals report.
Complementary tools include the Google Chrome DevTools Lighthouse panel, WebPageTest for granular filmstrip analysis, and Google Search Console for bulk URL insights across your site.
Test key templates – homepage, product pages, landing page variations, blog posts – not just the homepage. Mobile loading speed is usually more critical due to mobile-first indexing.
Technical speed maps directly to business outcomes. Here is how.
Core Web Vitals are used as SEO ranking signals within Google’s page experience system. When multiple pages compete with similar content and authority, the faster, more stable page tends to win. Optimizing page speed enhances user experience, conversions, and search visibility – all at once.
For Google Ads and Google Ad Grants accounts, a slow landing page drags down Quality Score, increases cost per click, and can trigger policy flags for grant accounts that drive traffic to low-quality experiences.
The user behavior data is stark:
Faster pages also improve engagement metrics – scroll depth, time on page, and interactions – that influence lead qualification in B2B funnels. Organizations that treat page speed as an ongoing KPI, tracked monthly alongside traffic and revenue, see compounding benefits: higher conversion rates, lower ad spend, and stronger retention.
Most slow loading websites share a handful of recurring speed issues visible in PSI and Lighthouse reports. A website is slow if it takes longer than 0.4 seconds to load, and the causes usually fall into predictable categories.
Front-end culprits:
Server-side contributors:
Drag-and-drop site builders and plugin-heavy CMS installs frequently generate bloated markup and scripts that require careful pruning. Check PSI’s “Opportunities” and “Diagnostics” sections – they provide a prioritized list of bottlenecks for each page, ranked by estimated impact.
Your backend architecture and hosting choices set the floor for how fast any page can load. No amount of front-end polish compensates for a slow server.
Server Response Time measures the time a server takes to respond to a request. Google recommends Time to First Byte should be under 200ms for a good experience. When your TTFB is high, every subsequent step in the loading process is delayed.
Strategies to improve server response time include:
At TVL IT Solutions, our backend web development services are designed around scalable architectures – microservices, caching layers, and autoscaling on major cloud providers – so custom platforms stay fast under traffic spikes without manual intervention.
Front-end assets typically account for the majority of page weight and directly affect LCP and CLS scores. Here is where the largest gains happen.
Images:
CSS optimization:
JavaScript strategies:
Browser caching: Configure cache-control and ETag headers so returning users load static resources from local cache. Static assets like images and CSS files can often be cached for weeks. HTML gets shorter lifetimes. This alone transforms repeat-visit performance for a faster website.
Combine these techniques into a cohesive build pipeline using modern bundlers and CI/CD rather than one-off manual fixes. Our frontend web development services team integrates these optimizations into every project’s standard workflow.
Marketing tags, analytics, and fonts often silently degrade performance – and they are the hardest to control because they come from external resources.
Third-party scripts (ad tags, social widgets, A/B testing tools, chat widgets) increase JavaScript execution time, block rendering, and worsen input delay when loaded synchronously. Every additional tag adds unpredictable latency.
Mitigation tactics:
Web font optimization:
These best practice steps directly reduce cumulative layout shift. Reserve explicit space for ads and embeds with CSS placeholders. Set dimensions on images and video containers. Avoid injecting content above existing elements late in the render cycle.
Collaboration between marketing and development teams is essential. Developers should provide clear performance budgets – for example, total third-party JS under a specific KB limit – so marketing additions do not silently push CWV scores into the “Poor” bucket.
Google page speed optimization is an ongoing process, not a one-time fix. Every new feature, content update, or third-party addition can introduce performance regressions.
Step 1: Baseline measurement Run PageSpeed Insights and Lighthouse against key page templates. Export details on LCP, INP, and CLS for both mobile and desktop devices. Note which pages fall into each performance category.
Step 2: Build a performance backlog Group issues by impact. Optimizing images and reducing JS payloads almost always deliver the largest gains. Smaller micro-optimizations (like font subsetting) come after the high-impact work.
Step 3: Set numeric targets Define measurable goals: LCP under 2.5 seconds for product pages on 4G, CLS below 0.1, INP in the “Good” bucket. Track progress over time using Search Console’s Core Web Vitals report.
Step 4: Integrate into CI/CD Use Lighthouse CI or similar tools to run automated checks during builds. Fail deployments when scores drop below agreed thresholds for critical templates. This prevents performance debt from accumulating silently.
Step 5: Ongoing monitoring Schedule recurring audits – monthly at minimum. Use real-user monitoring to catch regressions in field data that lab tests might miss. At TVL IT Solutions, we embed dashboards using PSI API and Search Console data so product owners can see performance trends alongside business KPIs.
Abstract recommendations become useful when you see them applied. Here are three anonymized examples from real engagements.
Example 1: B2B SaaS Platform (React Frontend) A SaaS client’s dashboard had initial LCP over 4 seconds on mobile due to a heavy React JS bundle and client-side rendering. We implemented server-side rendering with selective hydration, aggressive code splitting, and image optimization across the application. Mobile LCP dropped below 2.3 seconds. INP improved from “Poor” to “Good” after breaking monolithic event handlers into smaller tasks.
Example 2: eCommerce Product Pages An eCommerce client’s product pages averaged 3.2 MB page weight – bloated by uncompressed product photos and five third-party promotional widgets. Compressing images to WebP, lazy loading offscreen images, and deferring promotional scripts cut page weight by 60%. The site moved from a slow website to one that met all three core web vitals thresholds, and the client reported higher conversion rates within weeks.
Example 3: Nonprofit Google Ad Grants Landing Pages A nonprofit needed its key landing page templates to pass mobile PSI checks to maintain Ad Grants eligibility. We focused on improving server response time by moving to a CDN-backed setup, removed unnecessary page builder assets, and enabled browser caching for static resources. Mobile scores moved from the low 40s to above 90 in PageSpeed Insights.
Each engagement involved cross-functional work: UX design, backend optimization, front-end refactors, and ongoing monitoring – not isolated tweaks.
For custom platforms, designing for speed from the start is dramatically more effective than retrofitting performance after launch.
TVL IT Solutions approaches every project – whether custom software for startups and enterprises or SaaS platforms – with performance, scalability, and security as first-class architectural constraints.
Our backend and frontend development teams collaborate on performance budgets from sprint one. That means choosing API design patterns, caching strategies, and asset pipelines that support fast page load and quick interaction before a single line of production code ships.
We work across a range of technologies – JavaScript frameworks, .NET and Java backends, AI/ML components, Microsoft Dynamics, and Salesforce integrations – and we ensure that every integration is evaluated against its impact on site speed. Search engines reward this discipline, and users notice it immediately.
Speed is not a feature you bolt on after launch. It is a foundation you build from the first sprint.
If your field data tells a different story than your lab scores, or if your site consistently fails core web vitals on mobile, it is time to dig deeper. Reach out to TVL IT Solutions to discuss your current performance profile and explore how a dedicated development partner can embed google page speed optimization into your product roadmap – from architecture through deployment and beyond.
Google page speed optimization is the process of improving website loading speed, responsiveness, and visual stability to enhance user experience and Core Web Vitals performance.
The three Core Web Vitals are Largest Contentful Paint (LCP), Interaction to Next Paint (INP), and Cumulative Layout Shift (CLS).
You can improve Core Web Vitals by optimizing images, reducing JavaScript, eliminating render-blocking resources, improving server response time, using caching and CDNs, and preventing layout shifts.
You can measure page speed using Google PageSpeed Insights, Lighthouse, Chrome DevTools, Google Search Console, and other performance testing tools.
Page speed affects user experience and Core Web Vitals, which are part of Google’s page experience signals. Faster pages can also improve engagement and conversion performance.
At TVL IT Solutions, we specialize in delivering scalable, secure, and custom software development services tailored to your unique business needs. Whether you’re a startup or an enterprise, our team is ready to turn your vision into reality.
Get Started Now